You are here
Smoking and Mental Illness: Quick Facts
Sex Differences
Men with mental illness are more likely than women with mental illness to smoke cigarettes.

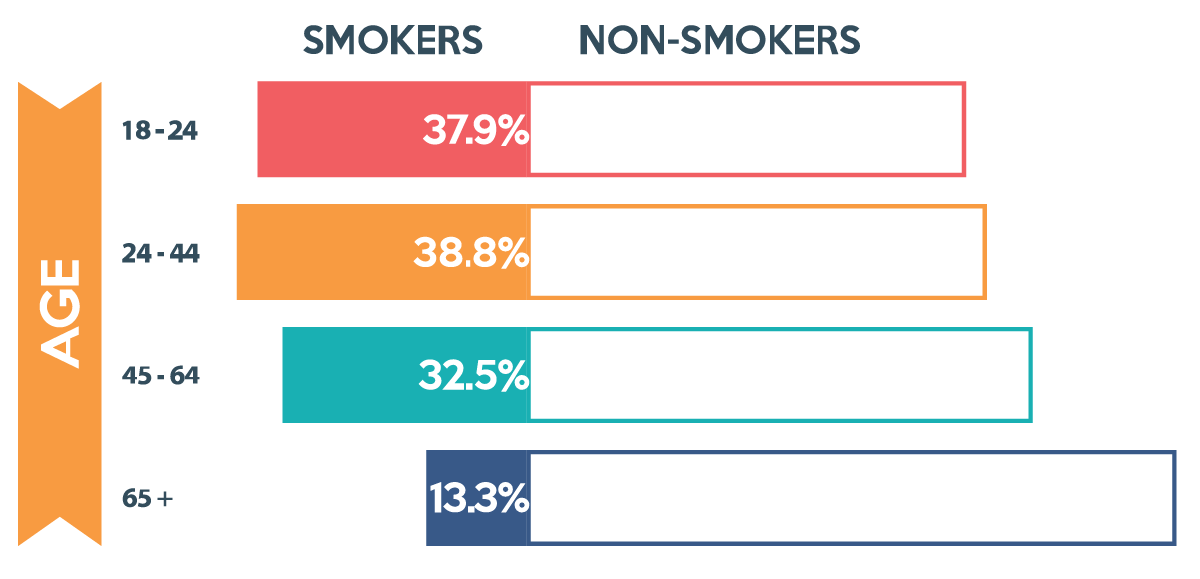
Age
Over 75% of people with mental illness who smoke cigarettes are under the age of 44.
Geography
Rates of smoking among people with mental illness vary from state to state.
 |
|
| Less than 30% people with a mental illness who smoke cigarettes | |
| 30 - 34% people with a mental illness who smoke cigarettes | |
| 35 - 39% people with a mental illness who smoke cigarettes | |
| 40 - 44% people with a mental illness who smoke cigarettes | |
| 45% or more people with a mental illness who smoke cigarettes |
The state with the least people with mental illness who smoke cigarettes is Connecticut (21.9%).
The state with the most people with mental illness who smoke cigarettes is Missouri (52.1%).
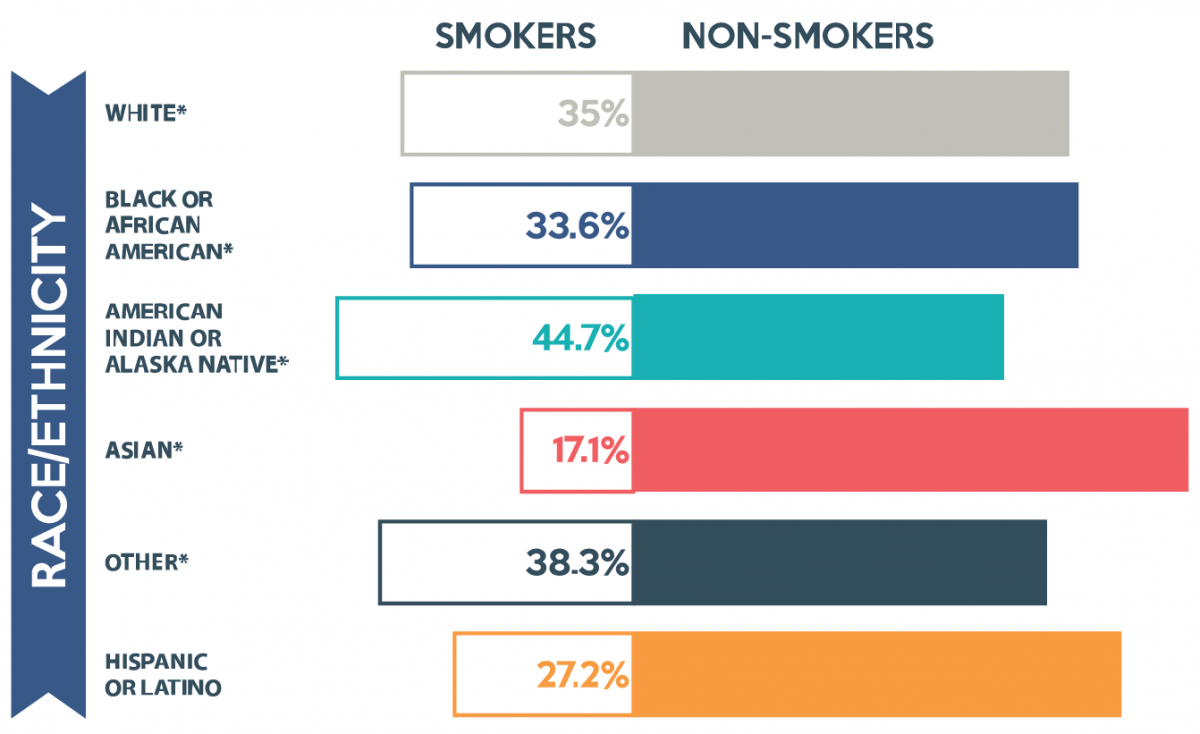
Race/Ethnicity
American Indian/Alaska Native people with mental illness are most likely to smoke.
Asian people with mental illness are the least likely to smoke.
Rates of smoking are fairly consistent among people with mental illness of black/african american, white, hispanic/latino, and other ethnicities.
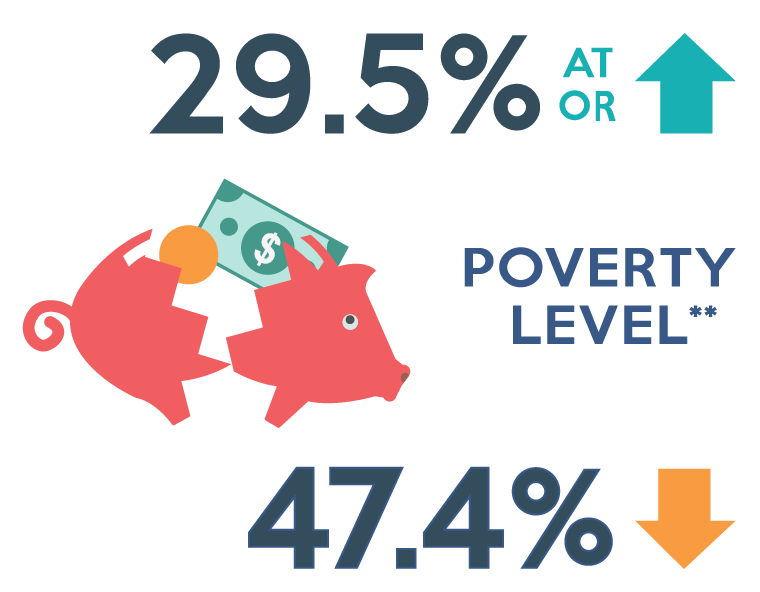
Poverty Status
People with mental illness who smoke are more likely to be below poverty level.
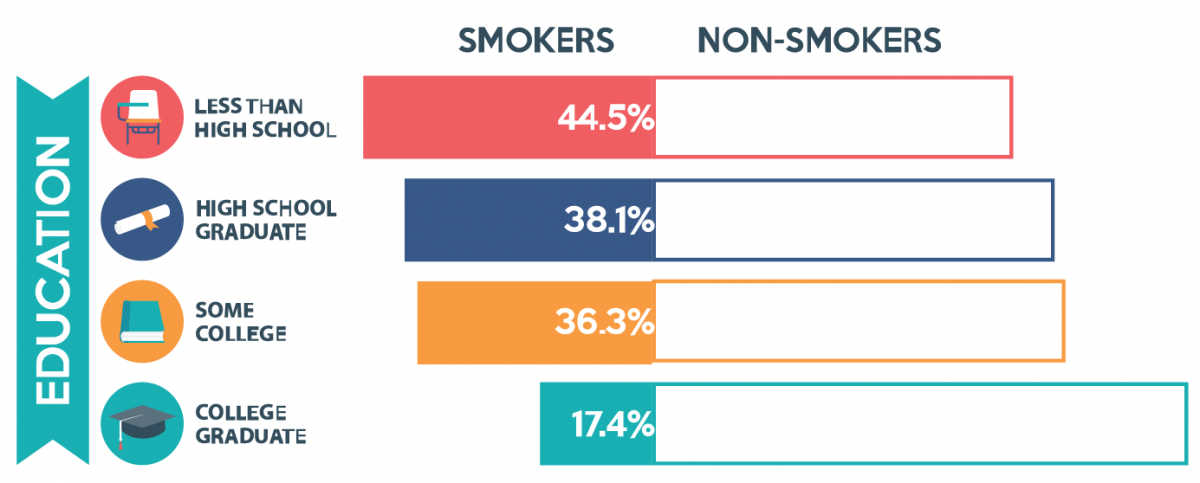
Education
The higher the level of education a person with mental illness has, the less likely they are to smoke.***
Also on mentalhealthamerica.net
Infographic: Smoking and Mental Illness - A Double Dilemma
Infographic: Smoking and Mental Illness - The Case for Quitting
Source
SAMHSA, Center for Behavioral Health Statistics and Quality, National Survey on Drug Use and Health, 2012-2014.
*Non-hispanic
**Estimates are based on a definition of Poverty Level that incorporates information on family income, size, and composition and is calculated as a percentage of the U.S. Census Bureau's poverty thresholds. Respondents aged 18 to 22 who were living in a college dormitory were excluded.
***Education estimates are among persons aged 25 or older.





this page